Hyperbolic Scaling
Want a quick explanation?Scroll to the video clip ↓
Hyperbolic scaling is a common scaling mechanism used in Megabonk. This is because some items would be far too powerful if they stacked linearly. For example, having 10 Keys does not give you a 100% chance to open every chest for free, even though the description says “+10% chance”. If the item used linear scaling, 10 stacks would equal 100%, which would be way too strong. Instead, like many other items, the Key uses hyperbolic scaling to ensure the value never reaches 100% and to introduce diminishing returns with each copy of the item.
A general hyperbolic scaling curve looks like this:
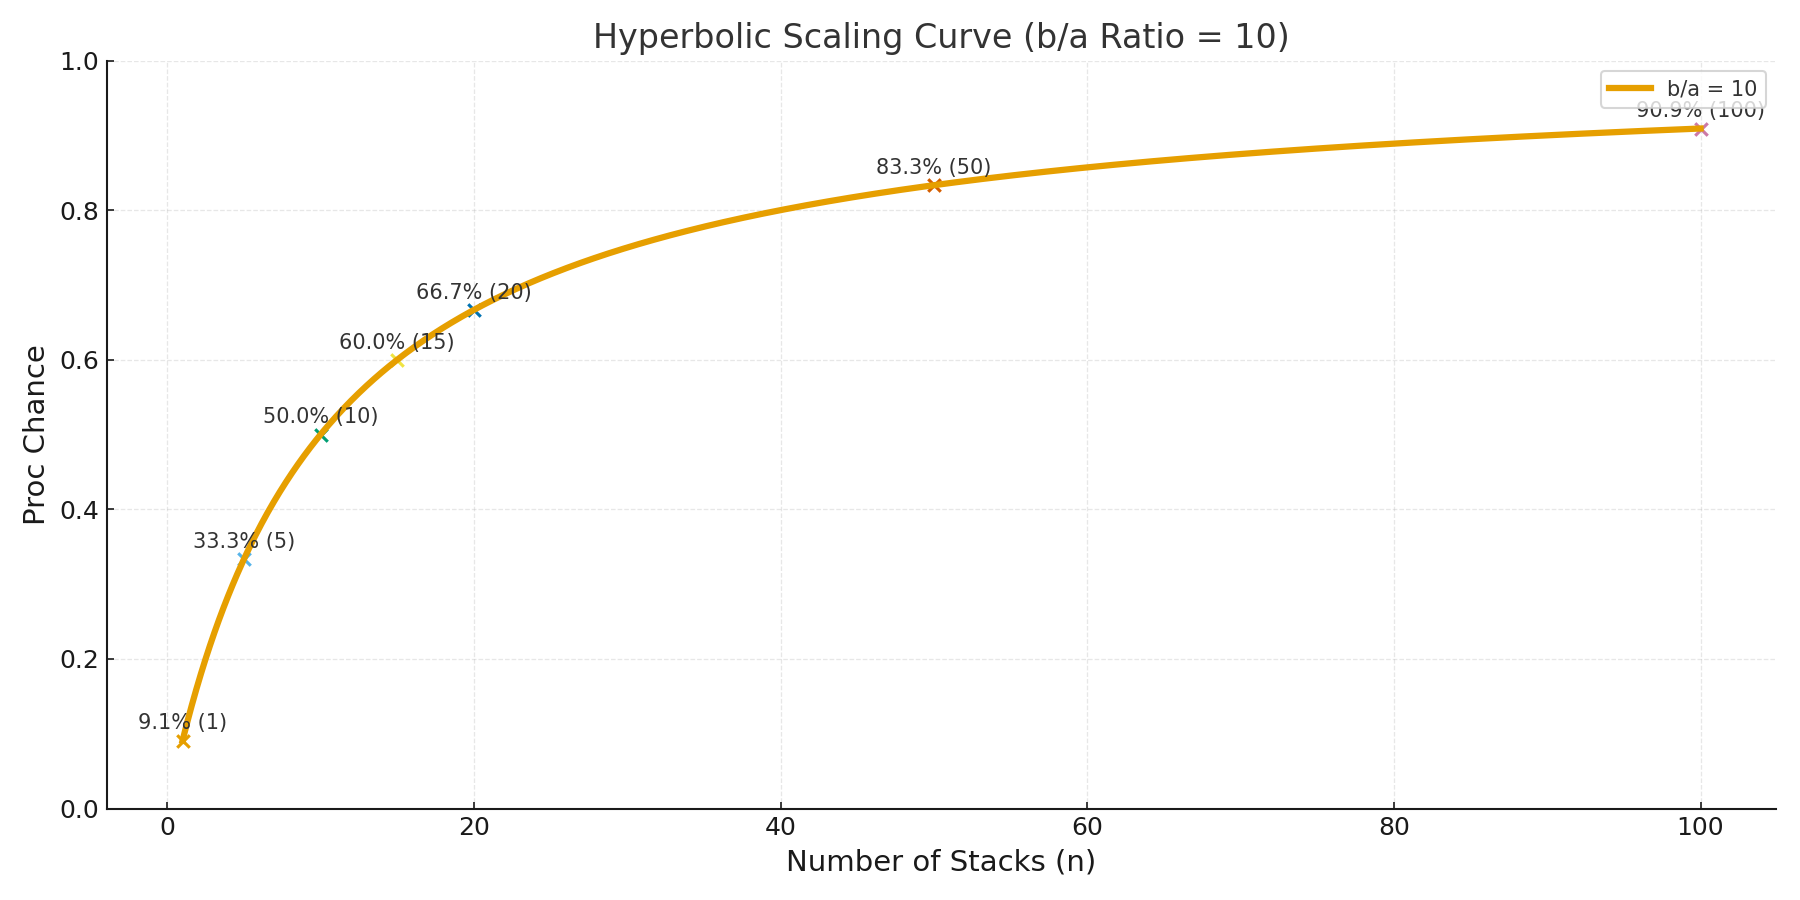
For every item that uses hyperbolic scaling, the in-game description ends up being slightly misleading. For instance, having 1 Key does not give you a 10% chance to open a chest, but only ~9.09% (rounded up to 9.1% in the image above). This is because the game displays the raw per-stack value (like “+10%”) before feeding the combined value into the hyperbolic scaling function. The real chance is calculated afterward.
The function looks like this:
input
The combined value that gets scaled. For items using hyperbolic scaling the game typically constructs this as:
For the Key,
maxValue
The upper limit the stat approaches but never reaches (an asymptote). For the Key this is 1.0 (100%). It can get extremely close, but only with absurd numbers of stacks.
(For example, ~99.99% is reached at about 9,999 Keys. Even one million Keys only reaches ~99.999%.)
scaling
The internal constant in the denominator. This value controls how quickly the stat approaches the maximum.
A small scaling means the stat increases quickly.
A large scaling means the stat rises very slowly.
This value has the biggest impact on how the item scales.
The hyperbolic scaling function is:
Where:
- $b$ = the function's
The input is defined as
So the scaled value as a function of stacks becomes:
Where:
- $n$ = number of stacks
- $a$ = raw input per stack (e.g., $0.075$ or $0.10$)
- $b$ = internal scaling constant (the function's
We can rewrite this as:
Define the effective curve parameter over stacks:
Then:
The key take-away here is that the shape of the curve (as you add stacks) depends only on the value of $k = b/a$.
The raw input value $a$ does not matter by itself; it only matters through the ratio $b/a$.
Two items with different rawValues will scale identically (over stacks) if their $k$ value is the same (and they share the same $maxValue$).
Both the Key and Ice Crystal end up with the same ratio $b/a = 10$.
Their raw values differ (0.1 for the Key and 0.075 for the Ice Crystal), but because their $b/a$ ratios are equal, they:
- start at the same real value (~9.09%)
- scale identically
- follow the same curve on the graph
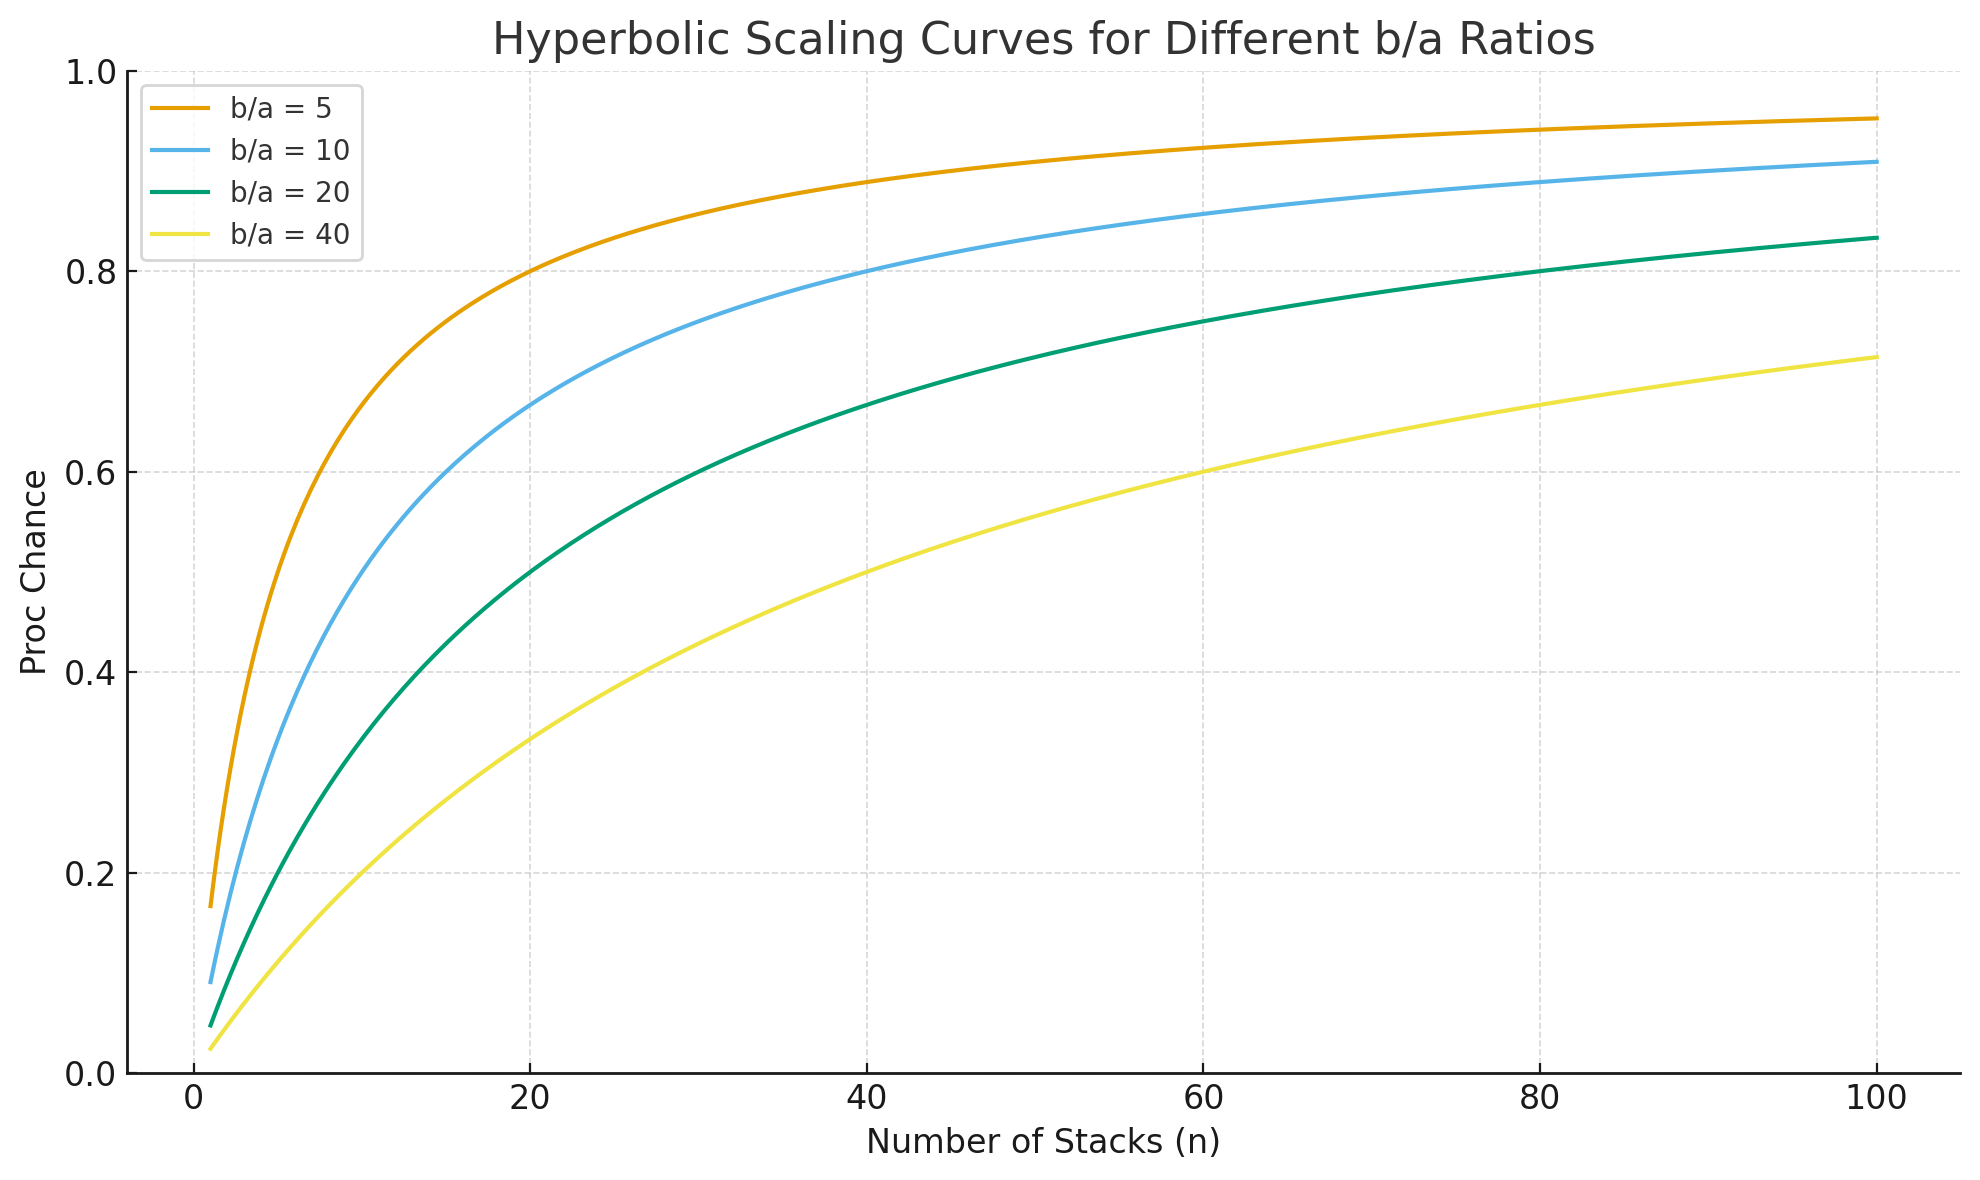
Below is a graph showing how different $b/a$ ratios change the scaling.
The Key and Ice Crystal both follow the blue line ($b/a = 10$). The other curves are for demonstration purposes.
A general hyperbolic scaling curve looks like this:
Note this is the scaling for the Key and the Ice Crystal - yes they are both identical although one says +10% and the other says +7.5%. Explained in greater detail later in this article.
When the image says 9.1% (1) that means for 1 copy of the item, there is a ~9.1% chance to procc
For every item that uses hyperbolic scaling, the in-game description ends up being slightly misleading. For instance, having 1 Key does not give you a 10% chance to open a chest, but only ~9.09% (rounded up to 9.1% in the image above). This is because the game displays the raw per-stack value (like “+10%”) before feeding the combined value into the hyperbolic scaling function. The real chance is calculated afterward.
The function looks like this:
HyperbolicScaling(input, maxValue, scaling)input
The combined value that gets scaled. For items using hyperbolic scaling the game typically constructs this as:
input = rawValuePerStack * stacksFor the Key,
rawValuePerStack is 0.1 (10%), so with 1 stack the input is 0.1. After scaling, this becomes ~9.09%.maxValue
The upper limit the stat approaches but never reaches (an asymptote). For the Key this is 1.0 (100%). It can get extremely close, but only with absurd numbers of stacks.
(For example, ~99.99% is reached at about 9,999 Keys. Even one million Keys only reaches ~99.999%.)
scaling
The internal constant in the denominator. This value controls how quickly the stat approaches the maximum.
A small scaling means the stat increases quickly.
A large scaling means the stat rises very slowly.
This value has the biggest impact on how the item scales.
Math behind the function
The hyperbolic scaling function is:
$$
f = maxValue \cdot \frac{input}{input + b}
$$
Where:
- $b$ = the function's
scaling parameterThe input is defined as
$$
input = a \cdot n
$$
So the scaled value as a function of stacks becomes:
$$
f(n) = maxValue \cdot \frac{a n}{a n + b}
$$
Where:
- $n$ = number of stacks
- $a$ = raw input per stack (e.g., $0.075$ or $0.10$)
- $b$ = internal scaling constant (the function's
scaling parameter)We can rewrite this as:
$$
f(n) = maxValue \cdot \frac{n}{n + \frac{b}{a}}
$$
Define the effective curve parameter over stacks:
$$
k = \frac{b}{a}
$$
Then:
$$
f(n) = maxValue \cdot \frac{n}{n + k}
$$
The key take-away here is that the shape of the curve (as you add stacks) depends only on the value of $k = b/a$.
The raw input value $a$ does not matter by itself; it only matters through the ratio $b/a$.
Two items with different rawValues will scale identically (over stacks) if their $k$ value is the same (and they share the same $maxValue$).
Example: Key and Ice Crystal
Both the Key and Ice Crystal end up with the same ratio $b/a = 10$.
Their raw values differ (0.1 for the Key and 0.075 for the Ice Crystal), but because their $b/a$ ratios are equal, they:
- start at the same real value (~9.09%)
- scale identically
- follow the same curve on the graph
Below is a graph showing how different $b/a$ ratios change the scaling.
The Key and Ice Crystal both follow the blue line ($b/a = 10$). The other curves are for demonstration purposes.
Table of values for different b/a ratios
A video that explains this concept: